
Authors: Michael Grantmyre and Ryan Unruch
General overview of preferred share financings in the Deal Points Report
Total preferred share financings, by year
In 2025, Osler represented 140 clients on preferred share financings, a 12.5% decline from 2024, closely tracking broader Canadian venture market activity. The CVCA similarly reported a 12% decline in total venture financings completed in Canada in 2025 (649 to 571 deals). Despite lower deal volume, aggregate deal value in Osler-led financings increased by approximately 22% year-over-year, from US$3.74 billion to US$4.5 billion.
Total preferred share financings, by quarter
In 2025, there was a relatively even distribution in the number of financings that closed in each quarter: 35 financings in Q1 (25.0%), 33 in Q2 (23.6%), 32 in Q3 (22.9%), and 40 financings in Q4 (28.6%), seeing the highest number of financings in 2025. When looking at the dollars invested, consistent with the data reported by the CVCA, a different story emerges, where Q4 saw a disproportionate amount of investment dollars (US$2.3 billion, representing 51.7% of the total deal value), followed by Q3 (US$1 billion, representing 22.4% of total deal value). Q2 saw the lowest investment amount (US$0.4 billion, representing 9.7% of total deal value).
Number of financings, by year and by series
Consistent with prior years, early-stage financings continued to dominate the number of Canadian financing rounds completed in 2025 (Seed — 40%; Series A — 30%). Despite this concentration, Seed and Series A rounds represented only 15.9% of total dollars invested in 2025. For the first time in 2025, Series D and beyond financings reached double digits, representing 10% of all financings completed and 43.6% of total dollars invested (US$1.96 billion), indicating ongoing portfolio maturation.
In terms of industry distribution, AI transactions were consistently represented across all stages, accounting for 21% to 30% of financings from Seed through Series D and beyond. This made AI the most evenly distributed sector in 2025, reflecting both sustained investor participation across the life cycle and continued progression of AI companies through successive financing stages rather than concentration at earlier rounds.
By contrast, cleantech companies were concentrated at the Series A stage (28.6%) and were not represented in Series D and beyond financings, while consumer/retail companies did not complete any financings beyond Series B in 2025.
Location of companies
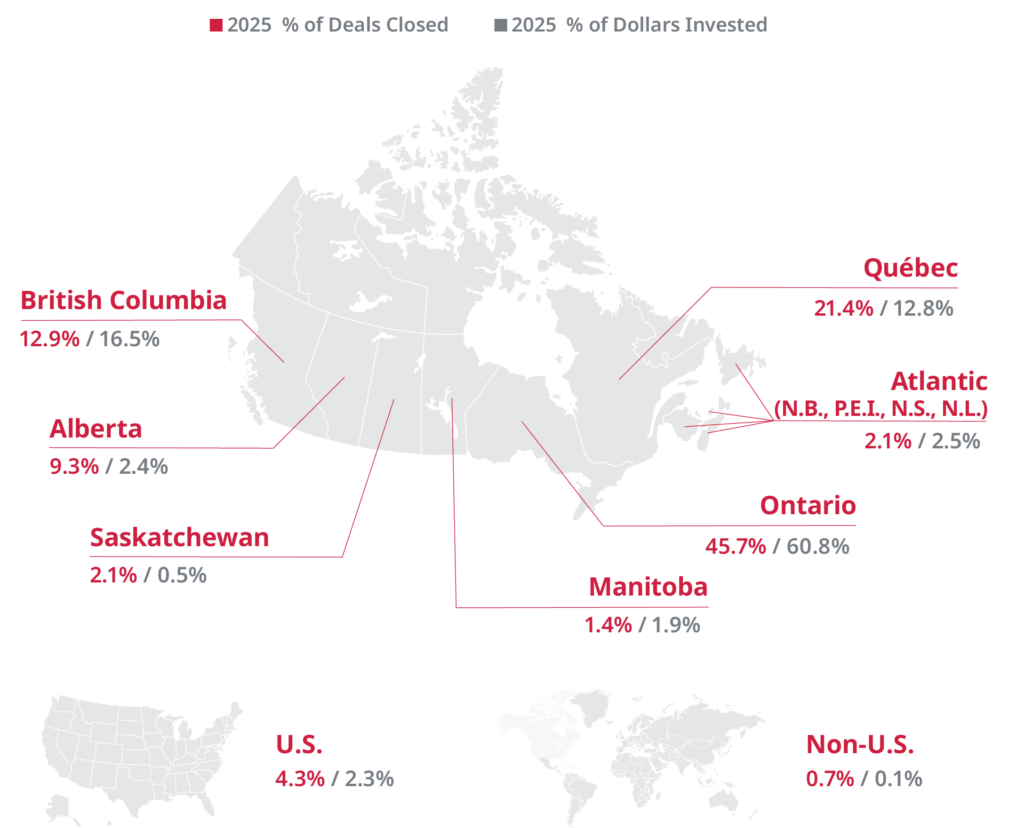
The diagram below displays the location of companies that completed a financing round covered by the Deal Points Report in 2025, including both the percentage of deals completed and the percentage of dollars invested in each province. As in prior years, venture financings were concentrated in Ontario, Québec and British Columbia. Ontario represented the largest number of financings in 2025 (45.7% of financings and 60.8% of dollars invested). Québec represented 21.4% of all rounds closed and 12.8% of all dollars invested. British Columbia represented 12.9% of deals and 16.5% of all dollars invested. The Prairie provinces continued to demonstrate growth, representing 12.9% of the financings closed in 2025. Interestingly, the average Ontario deal size increased from US$20 million in 2024 to US$42.7 million in 2025, driven by a higher concentration of later-stage financings by Ontario-based companies. Finally, the year saw a modest increase in activity in the Atlantic provinces (2.5% of total dollars invested), although this activity was concentrated in two large later-stage financings.
Company distribution by industry, by year
The financings included in the Deal Points Report were for companies distributed across a range of industries:
- AI (reported as a separate category since 2023)
- cleantech
- consumer/retail (including supply chain, logistics and consumer retail)
- fintech
- health/life sciences
- information technology (including blockchain, adtech, edtech and cybersecurity); for years prior to 2023, AI companies were included within this category
- other (industries which do not reasonably fit within the foregoing industry categories)
In 2025, AI emerged as a leading industry, representing 23.6% of all financings completed. Information technology represented 17.1% of financings, down from 23.1% in 2024 and 24.1% in 2023, alongside a broader shift in the technology and venture ecosystem toward AI. Cleantech continued its growth trajectory, representing 16.4% of 2025 financings (up from 14.4% in 2024).
Deal value distribution, by year
This chart illustrates the overall representation of industries based on series of financing, by deal value, from 2021 to 2025.
AI experienced strong growth in 2025, increasing from 34.0% in 2023 to 54.0% of all dollars invested in 2025 (representing 23.6% of all deals). In 2025, the Canadian market saw an all-time high for dollars invested (US$4.5 billion), which can be largely linked to increased investment in AI, with an increase of US$1.4 billion from 2024. Information technology, which was the leading sector by deal value in 2021 at 41.7% (noting that this figure includes AI, which was then included within the category), has fallen to 11.5% in 2025 as the composition of venture activity has shifted toward AI, including instances of legacy information technology companies transitioning toward AI.
Information technology was historically the dominant sector. In 2025, information technology represented just 17.1% of deals and 11.5% of capital invested. Even when tracking the data from 2023 when AI was separated from the information technology category, there has been a steady decline in information technology deal share, from 24.1% in 2023 to 23.1% in 2024 and 17.1% in 2025. This reflects a broader trend of capital migrating toward AI, as investors increasingly categorize a wider set of technology opportunities as AI opportunities, and show a preference for AI-native companies relative to traditional software and infrastructure businesses.
Fintech investment has fluctuated over the period covered by the Deal Points Report, reaching a low in 2023 (8%; US$125 million in total investment) and a record high in 2025 (20.2%; US$906 million in total investment), an approximately 625% increase over a two-year period. Average deal size also increased over the same period, from US$8.9 million to US$50.4 million, making fintech the second-largest average deal size behind AI.
Health/life sciences has shown variability over the period covered by the Deal Points Report, ranging from 6.3% of all dollars invested in 2022 to 17.3% in 2024, before declining to 6.2% in 2025. In deal volume, however, the health/life sciences sector demonstrated continuous growth and relative stability over the period, ranging from 9.2% in 2021 to 16.3% in 2022, 18.0% in 2023 and 18.1% in 2024, and rising further to 23.6% in 2025 (similar in this respect to AI).
While AI continues to outpace other sectors in both deal share and average deal size, health/life sciences has remained relatively stable in average deal size, with only modest growth over the period from 2023 to 2025 (1% compared to 177% in AI). This divergence highlights a broader shift in investor focus toward AI-driven opportunities, while health/life sciences activity has remained comparatively steady but less capital-intensive.
Over the five-year period covered by the Deal Points Report, consumer/retail has experienced a significant decline in financings, with a 62.5% reduction in deal flow and an 81% reduction in capital since 2021.
Companies by industry, by series
This chart illustrates the overall representation of industries based on financing stages, for 2025. The data show that AI companies represented a significant category of companies raising capital across all stages. AI was consistently represented across all stages (~20%–30% at each stage), illustrating that AI companies are successfully progressing through successive financing rounds, which indicates a more mature and sustained pattern of growth rather than a concentration of early-stage activity. Fintech was a clear standout in 2025, representing 35.7% of Series D and beyond financings (up from 2024 levels). Cleantech has a strong presence in early-stage financings, but had no deals beyond Series C.
Breakdown of women founders
In 2025, the percentage of women-founded companies that raised a financing round continued to increase, reaching 22.1% of all financings raised in 2025 (up from 21.3% in 2024 and 15.6% in 2021). Dollars raised by women founders also increased materially, doubling between 2024 and 2025 to reach US$1,016 million in 2025. This represents continued positive momentum for women founders in the Canadian venture ecosystem.
The underlying data in the Deal Points Report also show that women founders are represented across nearly every industry and at every stage of financing.
Osler supports women at all stages of building their companies by introducing them to our exceptional network of founders, established entrepreneurs and investors. Osler is a proud exclusive legal sponsor of Cap Inclusive’s Femtech Breakfast Club, Women Funding Women and OBIO’s Women in Health Initiative (WiHI) Breakfast Series. The firm also has a long-standing relationship with Women’s Equity Lab. Learn more about Osler’s programs for women founders, including links to prior webinar series.
Average time between term sheet signing date and financing closing date (by series)
This chart illustrates the average time, in days, between the date on which a term sheet was signed and the initial closing of the related financing. The 2025 data show a “barbell” pattern: Seed rounds (average — 81 days) are taking longer to close, while Series B and C rounds (average — 56 and 54 days respectively) are closing faster as capital flows more efficiently toward later-stage companies with more established metrics. Series D and beyond rounds (average — 64 days) took longer, reflecting the greater complexity and larger number of investors typically involved in these transactions.
Financings with exclusivity provision, duration (in days) by series
In 2025, the data shows that exclusivity periods averaged 43 days across all stages, remaining broadly within our expectation of the typical market range of 30 to 45 days, with earlier-stage financings including slightly longer exclusivity periods than later-stage transactions.
A conversation with Raquel Urtasun of Waabi
Osler clients share their success stories.
Watch the interview